ETL Testing
(Extract, Transform & Load)
for a Global Insurance Leader


Client Overview
The client is a global insurance leader focused on helping customers to solve unique risks. From its inception, the focus has been on diversification, superior product offerings, and unparalleled customer service. The breadth and depth of the Specialty and P&C coverage allow them to deliver tailored solutions on an integrated basis across multiple customer segments.
Project Overview
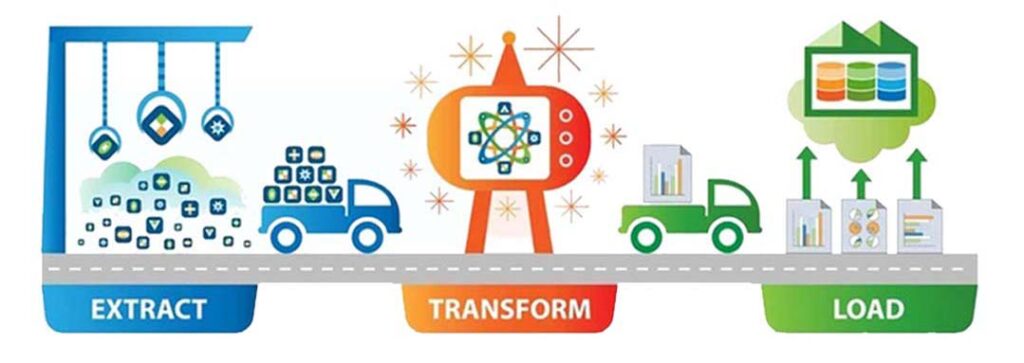
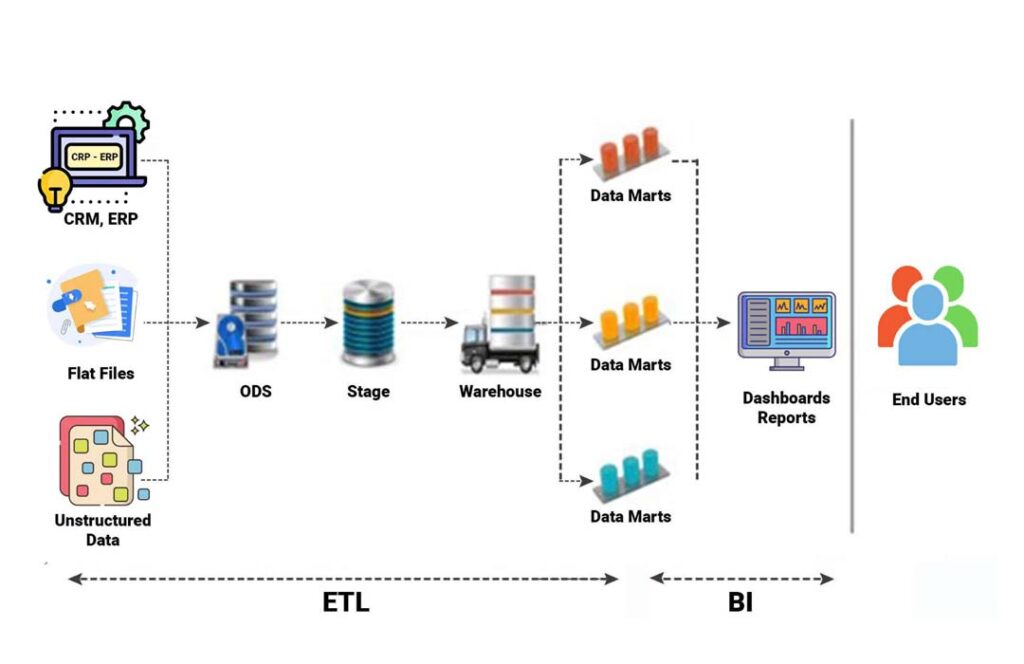
The project is to extract, transform & load (ETL) Policy or Claim data from the Source phase to the BI-Report. Each phase has a unique process and procedure. Based on the business requirement and mapping document development and testing are performed. It helped the client to analyze their business data for taking critical business decisions.
Challenge
The massive data comes in many formats such as JSON, XML, Text, CSV, and so on. They are reliant on manual and unstructured data collection from third-party vendors. The delay in processing data on some key performance indicators raised several operational risks.
They also lacked a well-modeled and centralized data repository, so each team had to create and maintain its own reporting processes, resulting in fragmented and limited reporting. The client was looking to find a more scalable, flexible, and affordable solution that would meet its increasing data storage and reporting needs.
Solution
XDuce designs develops, and implements ETL (Extract, Transform, and Load) solutions for handling large volumes of data with multiple source systems. The solution helps in transforming unstructured data into structured data and loading data to and from data marts and data warehouses. It enables the firm to quickly gain insights into the business ROI.
Microsoft Azure with Data Factory and Data Bricks have been chosen to address data complexity and big data, respectively. Utilizing the consolidated data in the data warehouse, Microsoft BI reports have helped gain a better understanding of several key performance indicators.
The pipelines have been prepared for each process, such as Source to Raw, Raw to Clean, and so on, and to apply the Extract, Transform, and Load (ETL) pipeline technique. Data extraction, transform & load from one phase to another phase is based on the business requirement document and mapping document.

TECHNOLOGIES
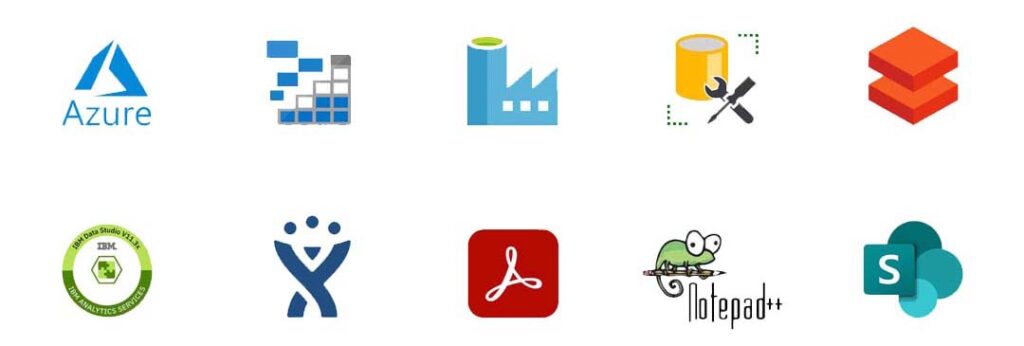
- Microsoft Azure
- Azure Storage Explorer
- Azure Data Factory
- SQL Server Management Studio
- Azure Databricks
- IBM Data Studio
- Jira
- Adobe Reader
- Notepad++
- SharePoint

Business Benefits:
XDuce Technology transformed the client’s reporting and analytics space to deliver an efficient and automated solution resulting in positive and quantifiable business outcomes.
Real-time data insights: Enhanced reporting capabilities utilizing Power BI models demonstrate actionable insight, giving the customer a strategic advantage and cost savings.
Easier Data availability: A centralized cloud-based data repository allowed for the consolidation of data related to insured profiles, member policies, premiums, claims, group policies, brokers and distributors, agencies and metadata for both internal and external insurance products, allowing for historical comparison and trend analysis.
Quicker reporting: Using an Azure cloud-based event-driven data pipeline for data transformation and storage, after BI report creation, the time to get reduced for specific reports.
Improved reports frequency: The frequency of reports was lowered from quarterly to bi-monthly utilizing an end-to-end automated BI system, resulting in faster data availability and greater understanding of risks, policy changes, and financials for planning and budgeting reasons.
360-degree views: Using Power BI for business analytics resulted in 360-degree insights of partner performance and client portfolios.
Contact Us
Let us know what you need, and one of our trained professionals will suggest the ideal solution for your business.
- Address 510 Thornall St. Suite 375 Edison, NJ 08837
- Email hello@xduce.com
- Phone +1 732-465-9100